How to work With Plot Styles
Tutorial how to work With Plot Styles in AutoCAD
You do not have to use plot styles in AutoCAD.
- if your plotter can output objects as they appear on-screen (and if this is what you want) then plot styles are not required.
- you may want to change some object properties at Plot time (only) and this is what plot styles were designed for.
Monochrome
Plot Devices
Many output devices (e.g. laser printers) produce output using only black ink or toner (i.e. monochrome).
- if you try to send color output to these monochrome devices your plots may not be of optimum quality.
- for example, lines may be faint or seem “pixilated”. One way to improve output on monochrome devices is to use a monochrome plot style that substitutes black ink for all screen colors.
- objects retain their color on-screen but are sent to the output device as if they were black (white on black backgrounds).
- technical drawings used to make blueprints should normally be created using monochrome plot styles.
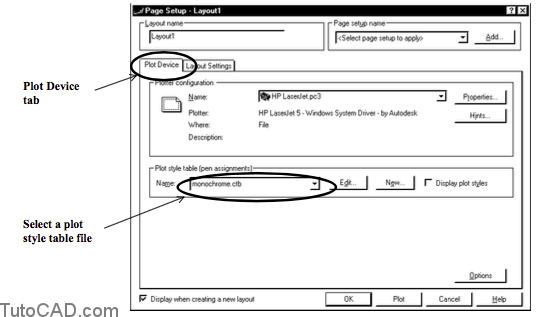
You must first attach a plot style table to a layout with the Page Setup before you can use plot styles when you Plot.
There are two different ways to use plot styles.
- you must select the plot style behavior that you prefer BEFORE you create a new drawing.
- once you make a new drawing it will use either color dependent plot styles or named plot styles and you cannot change this.
- if you create new drawings from a template (or use Saveas) the new drawing will use the same plot style behavior.


When you Use color dependent plot styles you map each object to a specific plot style according to the object’s color on-screen.
- this approach is similar to plotting in earlier AutoCAD releases and it is probably the easiest method to understand and use.
- you should use this approach if you plan to use the monochrome plot style table for monochrome output devices.
- color dependent plot styles are saved in plot style table files with a “ctb” file name extension.

When you Use named plot styles you can assign specific styles to each object explicitly and you can assign styles Bylayer.
- objects can then have a plot style as an object property just like objects can have color and linetype properties.
- named plot styles are also saved in plot style table files but these tables use an “stb” file name extension.
AutoCAD is supplied with several plot style table files.
- for example, the acad.ctb plot style table file plots objects (if possible) the way they appear on-screen.
You can edit these supplied table files and save them with a new name to create new customized table files
- or use Add-A-Plot Style Table Wizard to create new table files.
- double-click on the desired table file icon to open a plot style table file for editing.

You can also pick the Edit button in the Page Setup dialogue box to edit the plot style table file attached to the current page setup.
– you can only edit table file types (ctb or stb) that the active drawing was set up to use if you pick Edit on Page Setup.

The plot style table editor can be viewed in two different formats.
Use the Form View when you want more than one plot style to have the same setting(s) (practical for color dependent styles).
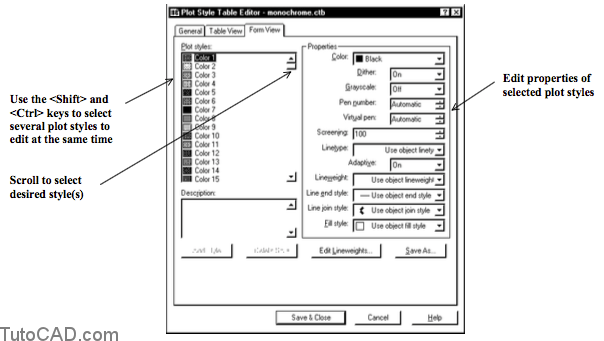
You can change properties of specific plot styles (without having to select the desired style first) in the Table View.
– this is practical for editing named plot style table files.

You can edit stb & ctb files using the same methods
-the primary difference between stb and ctb plot style table files is how objects are mapped to plot styles.
-the remainder of this section briefly describes the various editing options in the plot style table editor. You can Use object color for the plot style color so objects will plot using the same color in plots as they appear on your screen.
-or you can assign a specific plot style color to override the object’s color at plot time.
-this is how you can create a monochrome plot style (override the object color by selecting Black as the plot color).
-you can scroll to select the first 7 ACI colors directly or pick Other to select an ACI color from the complete color palette.

You can Enable Dithering to approximate colors using dot patterns.
-this can give the impression of plotting with more colors than the ink available in your plotter (if your plotter supports dithering).
-you can turn off dithering to avoid false line typing from dithering of thin vectors and to make dim colors more visible.
-colors are mapped to the nearest color (which can limit the range of colors used for plotting) if you turn off dithering.

When Grayscale is On the object’s colors are converted to gray scale if your plotter supports gray scale.
– turn Grayscale Off to use RGB values of object colors.

You describe the set of pens (physically) in the plotter (if your plotter uses pens) when you create a PC3 file for your plot device
-but PC3 files do not assign pens to plot styles.
-specify a pen number to use (1 to 32) or select Automatic to use the pen closest in color to the color of the object you are plotting.
![]()
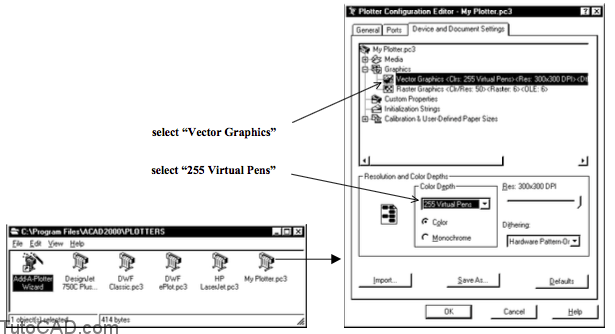
Some plotters (that do not use pens) can simulate a pen plotter by using virtual pens.
-you can use the Plotter Configuration Editor to edit a pc3 file by double-clicking on that pc3 file in your PLOTTERS folder.
-to configure plotters for virtual pens select Vector Graphics on the Device and Document Settings tab
-then select 255 Virtual Pens for the Color Depth.
You can program the pen width, fill pattern, end style, join style, and color/screening by using the front panel on these plotters.
– then specify a virtual pen number between 1 and 255 or select Automatic to use the AutoCAD Color Index (ACI).
![]()
You can change Screening to control the amount of ink used. – select a value for screening between 0 (reduces the color to white) or 100 (to display a color at full intensity)

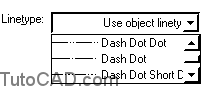
You can select a specific Plot style linetype to override the plot style linetype of an object at plot time.
– or you can select Use object linetype to have objects plot with the same linetype that is assigned to objects in the drawing.
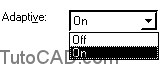
When Adaptive is Off, objects (which use lintetypes other than continuous) might end in the middle of a pattern.
– turn Adaptive Off if linetype scale is important or turn it On if it is more important to have complete linetype patterns
You can assign lineweights Bylayer (or even assign lineweights explicitly to objects which is not good CAD practice).
– the easiest approach to manage is to assign lineweight Bylayer and then select Use object lineweight for plot styles.
– however, you can override object lineweights by explicitly selecting a different lineweight in a plot style.

You can Use object end style so objects will terminate in plots in the same way as on-screen.
-if you select one of the other line end styles in the drop-down list it will override the object’s line end style at plot time.
-this setting becomes more important when you increase your lineweight settings.

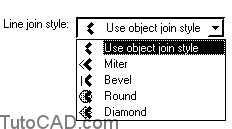
You can Use object join style so objects will join in plots in the same way that they appear on screen.
-if you select one of the other line join styles in the drop-down list it will override the object’s line join style at plot time.
-this setting becomes more important when you increase your lineweight settings.
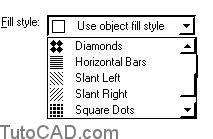
Fill style applies to (2D) solids, plines, donuts and 3D faces. – you can select a fill style from the drop-down to override an object’s fill style at plot time
– or you can Use object fill style instead.
practice using plot styles
- Close the drawing(s) from the previous exercise.
- Open the T115_9.dwg drawing file in your personal folder.
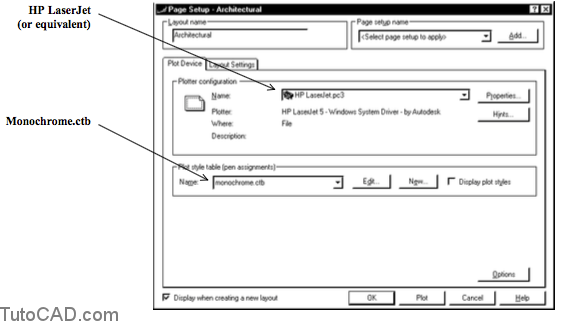
- Right-click on the Architectural tab and select Page Setup from the shortcut menu. On the Plot Device tab select the HP LaserJet.pc3 device file (or equivalent) and select Monchrome.ctb as the Name for the plot style table. Then pick OK (the Layout Settings are already set up).
4- Pick File + Plot Preview then press <enter>.
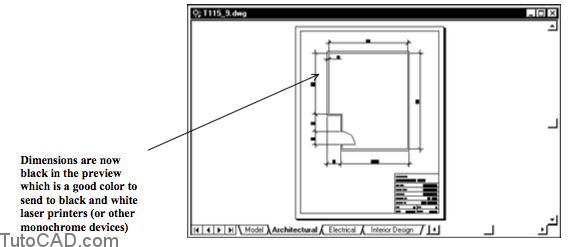
The effects of plot styles will be displayed on screen when you use the Preview command
– but you can also display plot styles as you work if you check the Display plot styles box in Page Setup.
5- Right-click on the Architectural tab and select Page Setup from the shortcut. Check Display plot styles on the Plot Device tab & pick OK to save these changes to this layout.

The dimensions (which are normally red on-screen) are displayed black (even when you are not looking at the plot Preview).
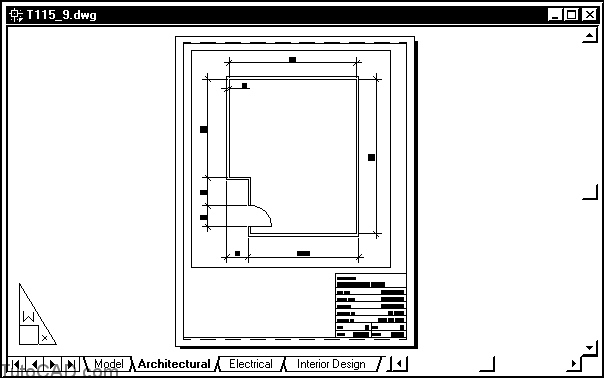
6- Left-click on the Interior Design tab to make it current.
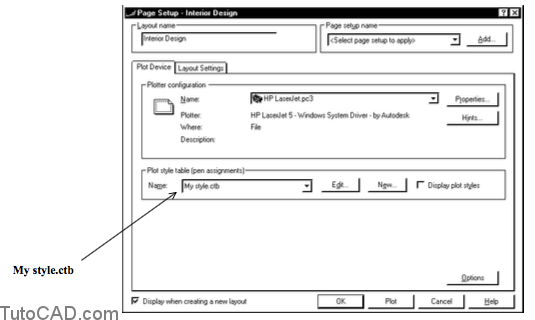
7- Right-click on the Interior Design tab and select Page Setup from the shortcut. Select the *Architectural* page setup in Page setup name drop down list. Remain in this dialogue box.

8- When you select the Architectural page setup name the Monochrome.stb plot style table file is used automatically on the Interior Design layout. Change the Plot style table to acad.ctb. & uncheck Display plot styles. Then pick OK.

9- Pick File + Plot Preview then press <enter>.

You would need an output device capable of reproducing the colors of all objects in your drawings if you use the acad.ctb table.
– acad.ctb may not be a good table file to use if your plotter is a monochrome device (e.g. black & white laser printer).
10- Pick File + Plot Style Manager to open the AutoCAD 2000/Plot Styles folder. If there is already a plot style table file called My style.ctb then select this icon and press the Delete key & pick Yes when asked if you want to send this file to the recycle bin. Then Close this folder.
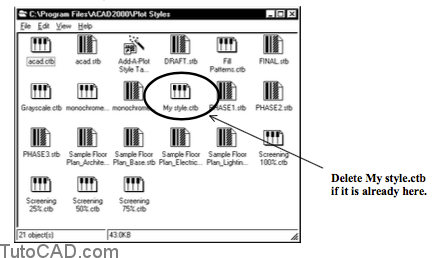
Another student may have already created the My style.ctb plot style table file that you are about to create in this exercise.
11- Right-click on the Interior Design tab and select Page Setup. Pick Edit on the Plot Device tab.

12- Pick the Save As button and enter My Style as the new table file name. Then pick Save to return to the Plot Style Table Editor again.
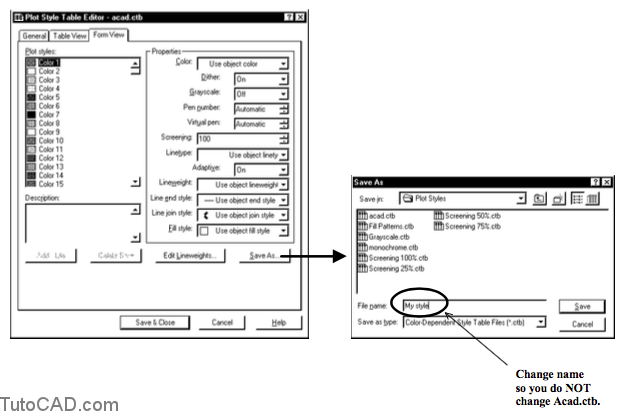
You should leave Acad.ctb defined as it is so other people will not be confused if they use your computer later on.
– if you need different plot styles you should create new table files.
13- Select Color 1 and then press & hold the <Shift> key while you scroll down the list to select Color 255 (all 255 AutoCAD screen colors should now be selected in the Plot styles list). Select Black for the Color in the Properties area. Then pick Save & Close.

You have just mapped all screen colors to Plot with the color Black which is the same as the supplied Monochrome.ctb table.
– all other plot properties are still assigned to use the object property at Plot time.
You could use the object screen color to control which property is used at Plot time for any other plot property (e.g. lineweight).
– this is what is meant by color dependent plot style behavior.
The acad.ctb plot style table file is still attached to the current layout
– you must select My style.ctb before you close Page Setup.
14- Select My style.ctb and pick OK.
15- Pick File + Plot Preview then press <Esc> to exit.

All objects appear Black in the Plot Preview because you have mapped all screen colors to Black.
– you get the same results as if you attached Monochrome.ctb to the Interior Design layout.
16- Save changes to this drawing and Close the file.
More Practice
practice creating and using named plot styles
- Close the drawing from the previous exercise if it is open.
- Open the T115_10.dwg drawing in your personal folder.


3- Right-click on Layout1 and select Move or Copy. Select (move to end) and check Create a copy. Then pick OK. Repeat to create a third layout.
4- Right-click on Layout1 and select Rename. Enter Phase 1 and pick OK. Use a similar technique to rename the other two layouts to Phase 2 and Phase 3 as shown below.

- Pick File + Plot Style Manager to open the AutoCAD 2000/Plot Styles folder. If there are already plot style table files called PHASE1.stb, PHASE2.stb & PHASE3.stb then select these icons and press the Delete key. Pick Yes when asked if you want to send these files to the recycle bin. Then Close this folder.
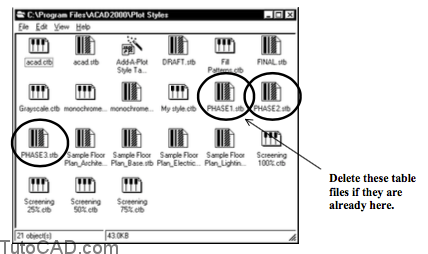
Another student may have already created the plot style table files that you are about to create in this exercise.
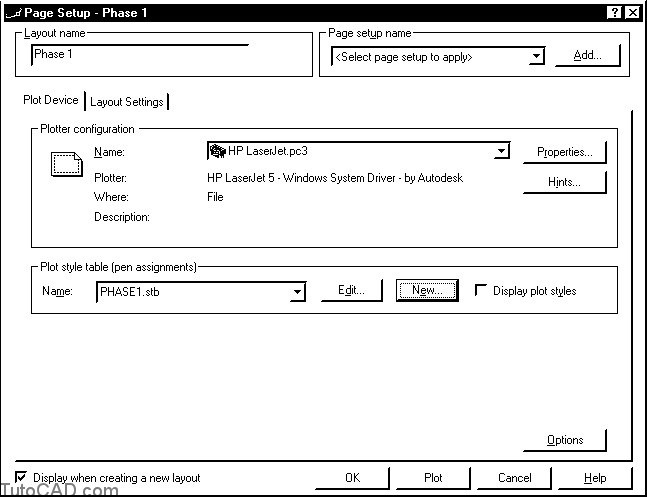
6- Right-click on the Phase 1 tab and select Page Setup. Select the HP LaserJet.pc3 (or equivalent) device as the Name on the Plot Device tab. Then pick New to begin creating a new plot style table file.

7- Select Start from scratch then pick Next.
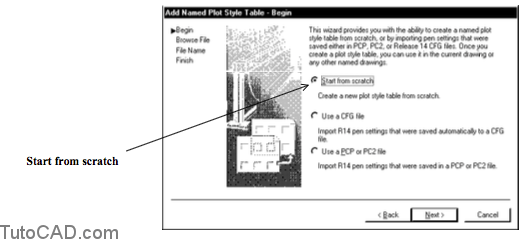
When you pick New in the Page Setup you invoke the Wizard to create new plot style table files.
8- Enter PHASE1 as the name and pick Next.

The active drawing was created for named plot style behavior
-so this Wizard automatically creates a new plot style with the same behavior (stb plot style table files).
-the plot style table file will have an stb file name extension automatically.
-you only have to enter the first part of the file name.
9- Pick the Plot Style Table Editor button to continue.
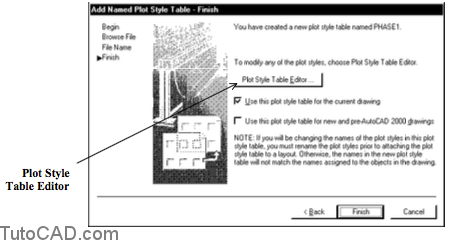
You could also edit this file later by double-clicking on the plot style table file icon in the AutoCAD 2000/Plot styles folder.
10- Pick the Add Style button. Change the new style name to Bldg A and select Red as the Color.

11- Use a similar technique to add three new styles shown below for Bldg B, Bldg C & Site. Then pick Save & Close to continue with the Wizard.

12- Pick Finish to terminate the Wizard.

13- Pick OK with PHASE1.stb selected as the Plot style table attached to the Phase 1 layout.
Now that the PHASE1.stb is attached to this layout you will be able to assign the named plot styles Bylayer.
– when the active drawing uses named plot style behavior you can select styles of an attached table in the Layer dialogue box.
– if the active drawing uses color dependent plot style behavior the plot styles in the Layer dialogue box are not available.
14- Pick Format + Layer. Left-click on the Normal plot style currently assigned to the BUILDING_A layer and select Bldg A as the style for all objects on this layer & pick OK. Use a similar technique to assign Bldg B to BUILDING_B, Bldg C to BUILDING_C and Site to SITE. Then pick OK.

15- Pick File + Plot Preview and press <Esc> to exit.

Objects on the BUILDING_A layer are Red in this preview and all other objects (on other layers) are gray (25% black).
– this is one way to highlight this building in plots of this layout. – you will highlight the other two buildings on the Phase 2 and Phase 3 layouts using a similar technique.
16- Select the Phase 2 tab to make it the current layout.
17- Right-click on the Phase 2 tab and pick Page Setup. Select the HP LaserJet.pc3 (or equivalent) device on the Plot Device tab. Select the PHASE1.stb file that you just created and pick the Edit button to continue.

18- Pick Save As and enter PHASE2 as the new style table file name and pick Save to return to the table editor. (You do not want to change PHASE1.stb).
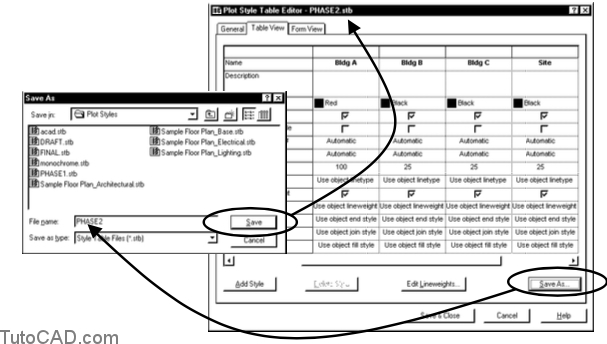
You will want to have identical names for styles in these table files and it is easier to Save As a new table file than to start from scratch.
-the styles will have the same names in different tables but the definitions of each style will be different in each table file.
-then when you attach these table files to different layouts you will get different results for each layout.
19- Make the Bldg A style use Black color with 25% screening and the Bldg B style use Red color with 100% screening. Pick Save & Close to complete the changes.

Now the Bldg A style will be like the other styles in this table file
– but this time the Bldg B style will stand out in plots that have the PHASE2.stb table attached.
– Bldg B style will use the color Red with 100% screening (solid).
20- Select PHASE2.stb for the Phase 2 tab and pick OK.
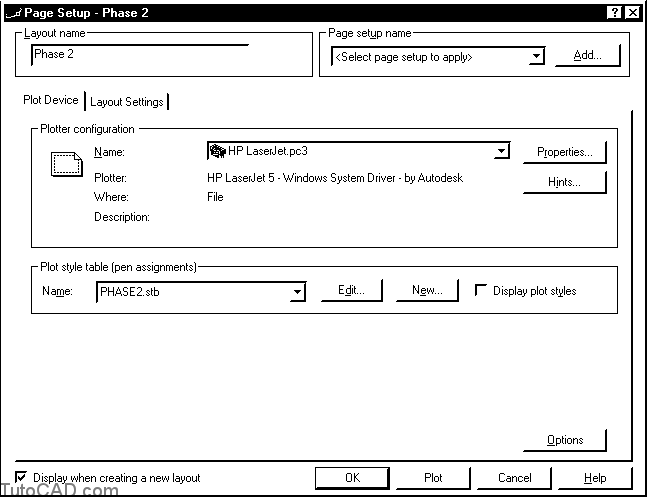
21- Pick File + Plot Preview and press <Esc> to exit.

22- Use a similar technique to highlight the BUILDING_C layer on Phase 3 layout by creating a new PHASE3.stb file.
23- Save this drawing and Close the file.