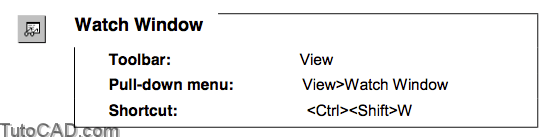
Watching Evaluations with autolisp in AutoCAD

The Watch Window allows you to follow the current value of symbol variables as they are run through the program. If you are having a problem with incorrect data types being passed to a function you could see the actual information process as it is happening.
Adding Symbols to the Watch Window
![]()
To add a symbol to the window, highlight the symbol name in the program, right-click, and pick Add Watch. You can also use the Add Watch button and type in the symbol name.
One useful symbol to watch is the Last Value variable. It keeps track of the last value used in an expression. To add this to your Watch Window, select Debug>Watch Last Evaluation from the pull-down menu.
Clearing Symbols from the Watch Window
![]()
To remove one symbol from the Watch Window, highlight it, right-click and select Remove from Watch. To clear the entire list, choose the Clear Window button in the Watch Window.
Animate Mode
The animate mode steps through your program showing each function as it evaluates it. It is most useful if you also have up the Watch window with the LAST-VALUE symbol showing. To start it choose Debug>Animate on the pull-down menu. This is an on/off toggle.
PRACTICE: WATCHING EVALUATIONS
In this practice you will load several symbols into the watch window and then view them after you have run the routine. You can also work with the Animate mode. Estimated time for completion: 5 minutes.
1. Open the SAW.LSP file if it is not already open. Add several symbols to the Watch window.
2. Run the program and then look at the values stored in the Window.
Optional: Animate
1. Highlight the “Get user input” section of the SAW routine and load the selection. Fill in the information in AutoCAD.
2. Turn Animate on and add LAST-VALUE to the Watch window if it is not already there.
3. Add several other symbols such as XCEN, YCEN, ANG1, PT1 and PT2 to the watch window.
4. Highlight the “Perform Calculations” section and load that selection. Watch what happens as it processes through. Check the values of the symbols.
Tip: Trace Log
You can save the information found in the Watch Window to a log file by pressing the Copy to Trace/Log button in the Watch Window. To start the trace log, go to File>Toggle Trace Log on the main Visual LISP pull-down menu. It will ask you which log file you wish to use; you can also append or replace an existing file. The Yes button will append and the No button will overwrite the file.